Working with a Simple PDCA Cycle
at Avans University of Applied Sciences
The intention of this paper is to share some of our experiences with implementing a simple ‘Plan Do Check Act’ (PDCA) cycle within our Learning and Innovation Centre (LIC). The PDCA-cycle is a never ending cycle designed to improve quality and efficiency. The PDCA as developed within LIC is not something completely new or innovative. But making use of the PDCA cycle enables us to link processes in a more effective way than before. In the current times of budget cuts the outcomes proved to be very useful.
The paper is divided in three parts. First some basic background information is given about Avans University. Secondly the implementation of the PDCA cycle is described in more detail with a special focus on the planning and checking elements of the PDCA cycle. Finally, some users are quoted who judge the PDCA cycle. Some recommendations based on two years’ experience are given at the end of this paper.
Avans University of Applied Sciences is located in three cities in the Netherlands: Breda, Tilburg and Den Bosch. It has 25,000 students and 40 bachelor’s programmes, 4 master’s programmes, one Learning and Innovation Centre and 22 research groups.
The management of the Learning and Innovation Centre reports directly to the executive board.
The Learning and Innovation Centre comprises seven teams. Each team has a specific focus in the overall task of supporting education and consequently individual teams have quite different activities. This variety reflects the fact that over the years the scope of the Learning Centre has become much wider than that of a library in the traditional sense.
The PDCA cycle we developed is applied primarily to our teams. The teams often work on a project basis with individuals representing different tasks.
The teams of the Learning and Innovation Centre are the following:
-
‘Consultancy’ mainly consists of educational policy advisors and e-learning advisors
-
‘Quality management and organisational development’ is specialized in supporting the accreditation processes and quality assurance
-
‘Research and evaluation’ is responsible for student surveys and evaluations (national student inquiries), general research, etc.
-
‘Virtual learning support’ is responsible for the multimedia studios, for online training and supporting Blackboard (the digital learning environment)
-
‘Information provision & collection management’ is responsible for staffing the information desk in the learning centre Xplora, collection development and workshops
-
‘Services and support’ is responsible for staffing the separate service desk in Xplora, cataloguing and application management
-
‘Information services’ are focussed on advising and building contact with our schools, specifically for the Learning Centre; they also do a lot of training.
A very basic and simple version of the PDCA cycle was implemented in 2009 based on performance indicators of the balanced scorecard.
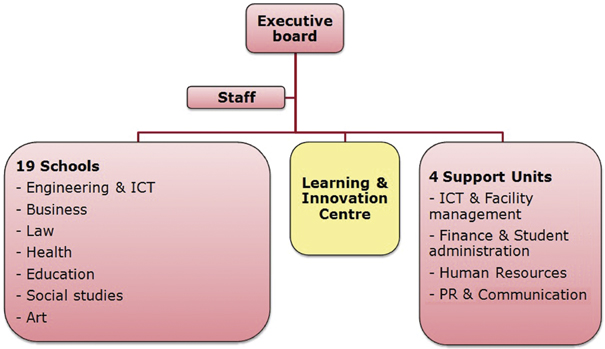
Figure 1: Organizational chart Avans University.
There were several reasons for implementing the PDCA cycle, most importantly:
-
Improved streamlining of processes: the PDCA cycle was implemented in parallel to the planning and control cycle of the whole university. Within Avans University working with the four perspectives of the Balanced Score Card is mandatory.
-
Developing more discipline in performing tasks.
-
Creating more transparency in activities and processes so it will become more clear on which activities time and money is actually spent.
-
The planned institutional audit of Avans in 2013: the quality assurance systems of the support departments are going to be critically examined.
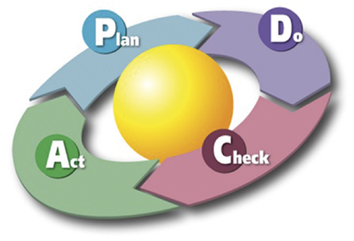
Figure 2: PDCA diagram (Karn G. Bulsuk)
Below we take a closer look at the different steps in the PDCA cycle, the Plan-Do-Check-Act cycle. Every step will be illustrated with examples from our organization.
The first step in the cycle is the planning process within the Avans University and of course also within the Learning and Innovation Centre, which starts every year in June. Management, team coordinators and the two account managers discuss the major trends and developments within the university. The major developments are presented in Figure 3. ‘Hippocampus’ is a programme aimed at academic success and integration. In addition there are ICT developments, developments within schools and, last but not least, the long-term policy of Avans University for the period 2011–2014. Each of these developments are important for our department.
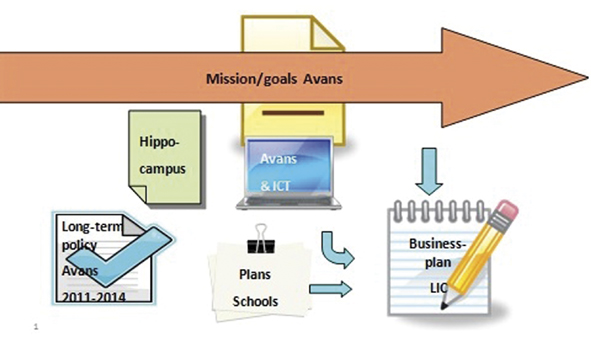
Figure 3: Planning process Business Plan Learning and Innovation Centre.
Based on the developments within Avans, the activities for 2012 are decided upon. Importantly each of our activities should contribute to the developments of the university as a whole and should be linked in some way to the long-term policy of Avans. In the business plan the goal and the corresponding results are described for every activity. Subsequently we translate the different activities into a budget and plan staff deployment. In October of every year, each school and department within our University has to present its business plan before the executive board.
As already mentioned, the business plan is drafted based on input delivered by team coordinators (and their staff) and the account managers. In turn, team coordinators prepare their own team plans based on the organisational business plan, with associated training and staffing plans.
Each of the support departments is required to develop an activity-based budget. This activity-based budget is in incremental to the regular budget which of course is also required. The aim of the activity budget is to provide more insight into how much money goes into which activities.
Let me give an example of the budget of the information services team. In the regular budget model based on the bookkeeping ledgers the total costs of k€732 are divided into staff, lending of staff, training, collection budget and ‘other’ costs, see Figure 4.
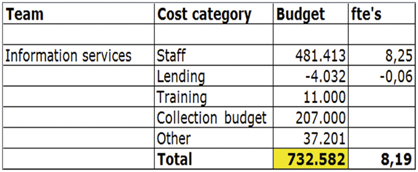
Figure 4: Regular budget 2010: example of the team Information Services.
In the new activity budget model we allocated the budget based on activities. First we identified the most important activities for all teams and, in this example, specifically for the information services team. We then decided how we would like to allocate the available ftes to the different activities, see Figure 5.
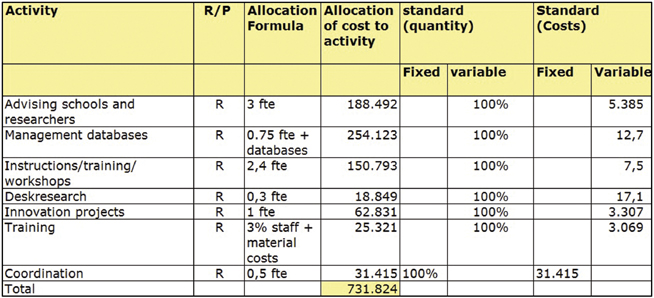
Figure 5: Activity budget 2010: Information services team.
For example the total costs of management databases consist not only of the costs of the licensees but also of the cost of staff for this section. Another example is the training costs. They are composed of the staff cost and the cost of the course itself. The entire regular budget was thus changed into an activity-based budget for all our teams. Our executive board is now much better informed about the costs and ftes involved in different activities. That makes discussions much easier.
We calculated how many ftes, or rather, how many man hours, would be spent on the different activities. Of course it is important to measure if the scheduled hours are really spent on these activities. Therefore, in 2009 a timesheet was introduced for almost all of the staff at the LIC to register working hours per activity. At the end of each quarter it is now possible to compare the scheduled hours of the team with the number of hours actually worked.
Each quarter we report at different levels. We are accountable to the executive board for realization of goals, our business plan, finance, staff, risk control, etc. The team coordinators in turn are accountable to us, and so on. Based on the reports provided, we have discussion at all levels.
Every quarter we have to provide the management report for the executive board. In 2009 we did an experiment because we were unhappy with the way we reported to the board. The preparation of management reporting took a lot of time, discussions with the executive board led to questions, because they had little understanding of the activities we carry out. Also, the LIC itself needed better management tools. We also had a great need for an overview at-a-glance of the present situation at the LIC with regard to the perspectives used by the balanced score card.
So we decided to develop a new way of reporting which would not only be useful for the executive board but also would be very useful for ourselves. A dashboard was developed which gives an at-a-glance overview of performance indicators on a quarterly basis (Figure 6).
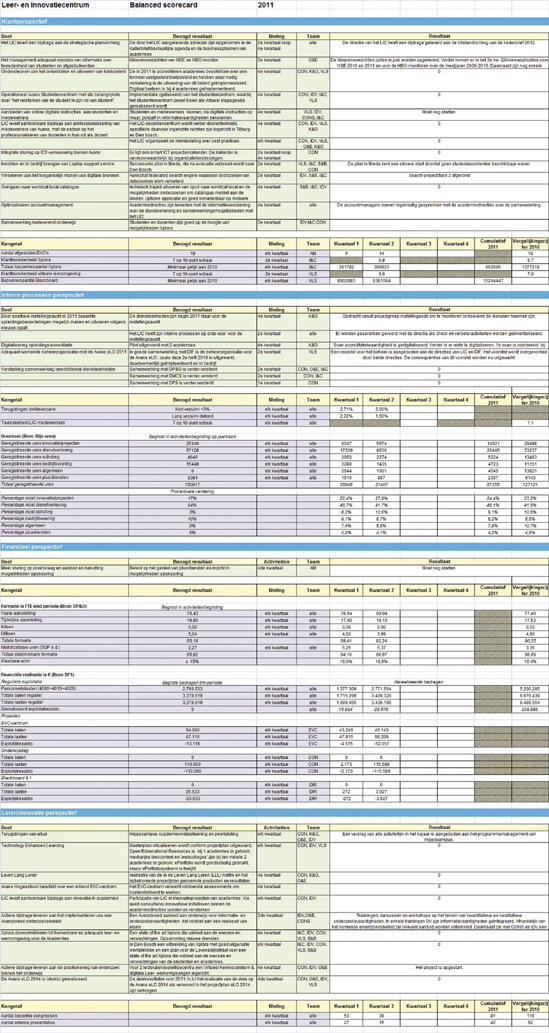
Figure 6: Example of LIC dashboard.
Since 2010 the dashboard is being used for reporting to our executive board about meeting specified goals and the realization of the business plan. Included in the dashboard are the goals and results on the basis of agreed performance indicators. The report to the board consists of the main dashboard plus an explanatory text and also a risk analysis. The members of the board and our controller are happy with the new way of reporting, and so are we. The dashboard is also used as a steering instrument for our own organization. We have a main dashboard for the executive board and internal dashboards for every team.
As mentioned earlier, making use of the balanced score card is mandatory. The balanced score card includes four perspectives: financial perspective, internal perspective, customer perspective and the innovative/learning perspective.
In the next section, the four perspectives will be described in a nutshell and a brief indication is given of what sort of issues are reported on.
Every quarter we report on activities focused on customers. We report on the total number of visitors of Xplora (the name of our Learning Centre), customer satisfaction with the virtual learning environment ‘Blackboard’, the total number of visitors to Blackboard, etc. We only report once a year on customer satisfaction with Xplora and Blackboard. In order to measure customer satisfaction, we use the results of the national student survey. As an add-on to this national survey Avans has added two questions about the virtual and physical learning environment (Figure 7).
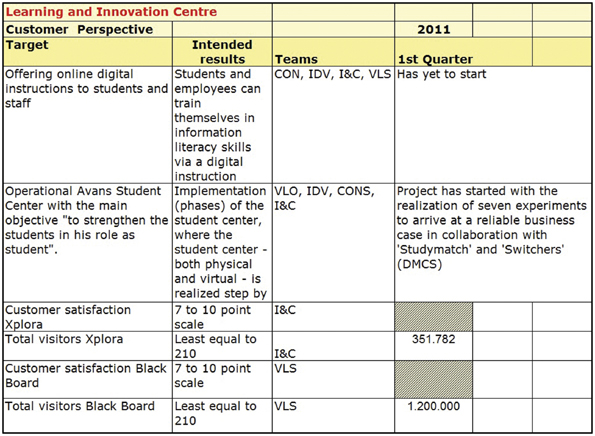
Figure 7: Section of the customer perspective of the overall dashboard.
The report (Figure 7) shows that digital instruction has not yet started. It is also reported that the student centre has started with seven experiments. The total number of visitors to Xplora in the first quarter of 2011 was 351,782.
The financial part of the dashboard is organized more or less the same way as the costumer perspective. In this perspective the focus is on the cost of staff and the general budget (Figure 8).
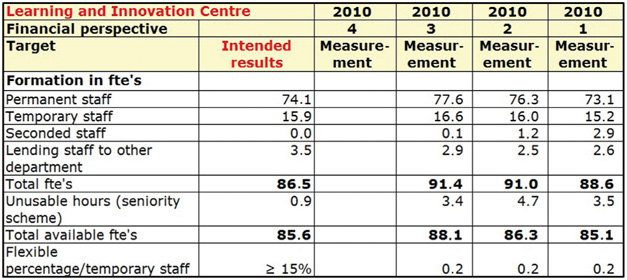
Figure 8: Section of the financial perspective of the overall dashboard.
In the dashboard the staff is divided into several groups: permanent and temporary staff, total available ftes and flexibletemporary part-time ftes. We report on a number of line items, i.e. regular operation costs, staff costs, the total regular income, total regular expenses, achieved operating balance and the financial situation of the different projects.
The dashboard makes it possible to follow at-a-glance the financial and staff developments over the year. Monthly reports from the departments of human resources and finance are the input for the dashboards. The dashboard in Figure 8 shows that we seconded 2,9 fte to another department until the third quarter. The seconded staff then switched to our department. And because the seconded staff had a permanent employment contract, this then led to an increase in our permanent staff. The executive board requires that 15% of the total ftes are temporary staff. Developments related to permanent and temporary staff are very easy to follow with the dashboard.
The third perspective is the internal perspective. Here we deal with matters such as hours registered, percentage of hours spent, figures on absenteeism and employee satisfaction, etc.
The planned hours (intended results) are compared to the number of hours actually worked. Input for the actually worked hours are the timesheets that all employees fill out.
The same can be done based on percentages of hours actually worked, as shown in Figure 9. This is also an example from the information services team. As you can see they spent a lot of time on training during the first two quarters.
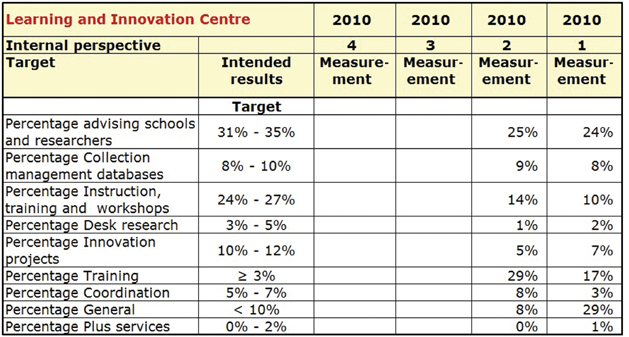
Figure 9: Percentage of hours actually worked: information and services team.
On the basis of all registered hours it is also very easy to produce a pie chart which gives a clear overview of the spent time on the activities for our entire department (Figure 10).
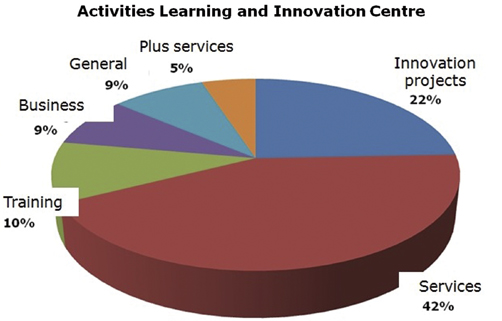
Figure 10: Pie chart of activities.
On the basis of the quarterly reports (this report includes the different dashboards, the explanatory text and the risk analyses) we decide whether changes need to be made to improve the processes.
The last step completes the circle and then the ‘design or revise’ of the business components starts all over again. The PDCA is a never-ending cycle designed to improve quality and efficiency.
We started in 2009 with the implementation of a basic quality system and we are still improving the cycle. This year all team coordinators were asked not only to collect and describe the present results, but also to provide an analysis and reflection on the results. The LIC is closely involved in the preparation of the Institutional Audit 2013 for the whole of Avans. In this audit the quality assurance systems of the support departments of Avans are going to be critically examined. Besides working on the basic quality, we are also focusing on the concept of enhanced quality. Next autumn we are going to discuss and select the topics at which we want to be more than merely ‘good’; where do we want to excel?
-
Marja Kamsma MBA/MBI (Member executive board Avans): ‘It’s an iterative working routine that is constantly improved, which for me as a member of the board is getting more convenient all the time and allows me to understand where the LIC stands and where it is headed’.
-
Henri Vossen (Concern Controller Avans): It’s trustworthy if an organization like LIC governs its own processes in enough detail to be able to see the things it needs to see and at the same time provides mature information giving me an understanding of how things develop in risk and control as a whole’.
-
Rien Brouwers (Director LIC): ‘The situation changes daily, so you’ve got to keep your finger on the pulse’.
-
Sandra Brocx (Team coordinator LIC): ‘Working with the PCDA cycle provides insight, information and guidance with regard to my team. It helps making strategic choices’.
-
Linda Brouwers (Team coordinator LIC): ‘The PDCA gives me clarity and an overview.’
-
Niek Van Hoof-Verhagen (Information specialist): Fear: ‘I didn’t know that I spend such an incredible number of hours on information skills workshops’; relief: ‘I spend much more time than I thought on advising schools’; insight: ‘I really need to delegate some activities, organize them differently or even stop doing some activities’.
-
Ellen Simons (Deputy Director LIC): ‘Necessary adjustments to processes can now be based on objective information’.
Based on our experience over the last two years I have some recommendations which could be of interest to other institutions. First of all: keep it simple. Maybe our approach looks very complicated but in practice it is very simple. The second recommendation is that I would strongly recommend not using the outcomes of the measurements as a control instrument directed towards your staff. And my final recommendation is that if you have collected a lot of data on all your activities, it is very easy to produce a factsheet with facts and figures.
In conclusion our PDCA cycle has really improved matters over the last two years. Because of the chosen approach we now have much more objective insight and information about our organization and about the different teams. It is now much easier to make decisions about changes in processes. Also the discussions with the executive board have improved in quality because the discussions are less about assumptions and more about objective numbers.
|
Balanced score card, http://www.balancedscorecard.org/thedemingcycle/tabid/112/default.aspx.
|