Evaluating New Geographic Retrieval Technologies for the Future Map Library
A powerpoint presentation including more illustrations is available from http://liber.gdc.2008.googlepages.com/Fleet_LIBER.pdf.
In recent years technology has dramatically expanded the possibilities for making available historical maps on the web. These various new techniques are examined and evaluated. It is argued that map curators are well placed to exploit these new techniques, and doing so has a range of advantages for the future survival of our institutions. The priorities and principles that should guide this work are suggested, along with the main practical conclusions for website presentation.
Whether on paper or on the computer screen, the graphic index is the one of the key tools that unites map librarians, and technology has dramatically expanded its potential in recent years. An explosion of web-mapping technologies, particularly furthered by Google Maps and Google Earth have created new possibilities for delivering geographic information to an increasingly map-literate user base. Technology continues to make geo-referencing maps and merging geo-referenced information together much easier, furthered by a growing awareness of the commercial potential of geo-referencing. A growing body of open source software is allowing new ways of interacting with old maps, geo-referencing, and delivering maps online (Pridal & Zabicka, 2008).[1]
Against this background, this paper begins by asking why these new geographical retrieval technologies are important for the future survival of map curators and their collections, and why map libraries need to embrace these new technologies. A second section reviews the main fundamental alternatives for making available historical maps on the web. By evaluating these alternatives, map curators are better placed for assessing technological solutions and prioritising work. A third section examines the main priorities and principles that should guide work in this area, whilst a final section brings these various strands together by suggesting the practical conclusions for website presentation.
This paper is focused on principles rather than on the latest software, and on the longer-term priorities that should guide work rather than on particular interfaces. The National Library of Scotland (NLS)'s website is used as a case study to address these questions. From 2000, with the NLS Pont map website (Fleet, 2000) scanning early maps and making them available on the web has been prioritised. From 2004, NLS began to deliver geo-referenced mapping (Fleet, 2005) but this still forms a small proportion of total content. NLS now delivers over 6,000 historical maps of Scotland relating to the time period from 1560 to 1928, and during 2007 the main map home page recorded 2.24 million hits and 7.29 million map image views. Although the primary motives have been to make available mapping in a clear, intuitive and pleasing way, these motives have been constrained by limitations of funding, time and expertise. For this reason, the site is useful in illustrating real-world compromise, of value to criticise and improve upon, not as an exemplar to emulate.
There are five main reasons why map collections should embrace these new technologies:
1.1. Increasingly the web is the sole communication/information channel for map libraries. Expressed more directly, if most users of map libraries are remote users, then unless we can provide good remote services, then our collections will be sidelined and invisible.
1.2. It focuses attention on the user. Graphic retrieval technologies are inherently user-orientated, as their main purpose is delivering information to the user. Designing these applications, thinking about them, and answering questions on them demands that map curators actively engage with the user.
1.3. Graphic retrieval technologies are a niche that map curators are best placed to develop. Through specialisation, in larger institutions many other parts of library and information work (e.g. acquisitions, cataloguing, promotion) have been partly or wholly taken over by other professionals or departments. However, map curators should still be able to promote themselves as experts in geographic information retrieval.
1.4. It lays the basis for a broader library role in retrieving geographic information. The recognition that ‘everything happens somewhere’[2] — or expressed differently that 80% of all information has a geographic component, means that maps today are increasingly used for accessing and organising other information. Through geo-referencing of information and web-mapping technology, maps today are not just ends in themselves, but means to other ends, and these geographic retrieval technologies have an applicability way beyond the map library for retrieving other resources.
1.5. It provides a stronger basis for repurposing information for different publications. The ability to integrate geo-referenced maps with other information provides a range of new opportunities for collaborating with other institutions, and repurposing maps in different and new publications. For example, in 2007 the NLS collaborated with the publisher, Birlinn, and the British Library in the facsimile publication of the Roy Military Survey of Scotland (Roy, 2007). Plate boundaries were drawn as a layer on top of the geo-referenced map, and an alphabetical index was easily created (through an overlay query in a GIS) of parish and burgh names, and the plates that showed these administrative units. In addition, the plate boundaries layer could then be tested with a backdrop of various other geo-referenced map layers of Scotland to create an appropriate graphic index for the volume (Figure 1).
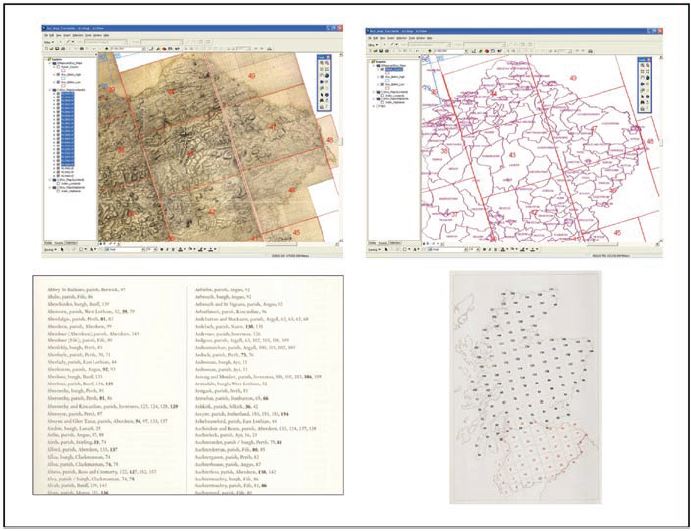
Figure 1: The geo-referenced overlay of plate boundaries and administrative units for the Roy Military Survey, for generating an index of names and a graphic index map.
The NLS Web Mapping Service allows geo-referenced mapping to be dynamically used by other institutions (including the Royal Commission on the Ancient and Historic Monuments of Scotland and Historic Scotland) as a layer of cartographic information within their own web services. The same WMS mapping is also used in an educational context by Edinburgh University.[3]
In the non-digital world, the tools for accessing historical maps have traditionally been either text-based lists of varying types, or graphic indices (Table 1). Ordering and arrangement has always been at the heart of librarianship, and in an online environment where ease of use, efficiency and speed are even more important (and scrolling to be minimised), a textual list in a sensible order is even more valuable. In the digital world, both textual lists and graphic indices still have value but they require modification, and through transformation, they can extend and enhance their hard-copy equivalents.
It is useful to divide the second main alternative, static clickable images, into two types: first scanned versions of original graphic indices, and second, those created digitally. Scanned graphic indices can sometimes be clear enough as clickable maps,[4] or as a set of thumbnail images laid out on a screen page as the sheets co-arrange and fit together,[5] but it is often the case that they are too large or too detailed for screen presentation, and clearer born-digital graphic indices can be created.[6]
Of greater relevance in recent years are newer digital technologies for presenting historical mapping in dynamic mapping applications. Series mapping can be cropped and mosaicked together, without necessarily geo-referencing it, and a large mosaic made available as a dynamic map.[7] Geo-referencing can allow many additional possibilities, not only in forming the mosaic of series sheets itself, but also in providing a mechanism for linking material geographically, for better geospatial indexing and retrieval, and through using geographic tools including dynamic web mapping services.
Table 1: Comparison of the main methods of presenting historical mapping.
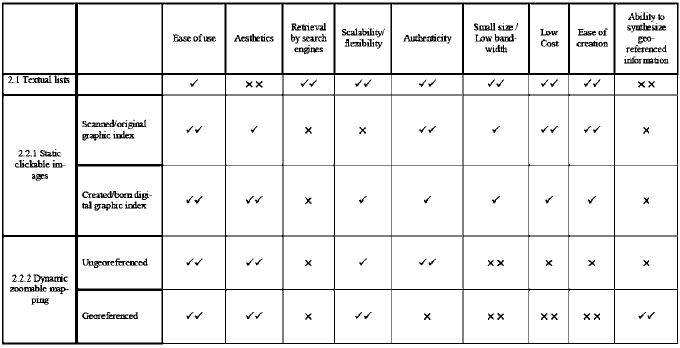
2.1. There are many advantages of textual lists for accessing series mapping. For most users, they are the most simple, intuitive and efficient access method, they are the most retrievable of all by Internet search engines, and for this reason alone perhaps should be regarded as essential. They are very scalable and flexible, and they represent their original authentically, for example as lists of contents or as author/title/place-name index. They consume the lowest bandwidth of all, and they are relatively cheap and easy to create.
2.2.1. As we move onto static clickable images, we find that the aesthetic and intuitive advantages of graphics, whilst better than text, are mixed, and offset by the disadvantages of being invisible to search engines, in consuming greater bandwidth, lack of flexibility (especially for scanned graphics), and in greater costs of creation for born digital graphics.
2.2.2. Dynamic mapping applications can overcome many of the visual shortcomings of static graphic indices, through presenting multiple layers and scales of zoomable mapping. They supersede traditional offline search methods by allowing the ability to integrate the equivalent of gazetteers, atlases, and maps along with the graphic index in one application.[8] They are much more flexible, if the interface needs to be changed, if different mapping or search facilities are required, or in allowing modifications to series and sheet coverage. Finally, they allow the potential for dynamic online collaborative applications through Open Geospatial Consortium Web Mapping Services or Web Feature Services.
Unfortunately, the costs of creating dynamic zoomable applications, in terms of software, expertise, and time, are by far the greatest of all. Cropping and seaming together series mapping is labour-intensive, and the resulting image sizes often require powerful servers and specialised software. Web-mapping applications are heavy users of bandwidth, even through there are a growing number of techniques for reducing this overhead. Given the fact that most of the indexable content of the application is currently invisible to search engines, dynamic web-mapping is hard to discover through these, although there are emerging services, portals and infrastructures using gazetteers and metadata for retrieval. Finally, for users, most dynamic web-mapping applications are undoubtedly more complicated than static graphic indices and textual methods.
2.3. Website statistics and usability studies can provide interesting feedback on the preferences of users for these various methods of accessing historical mapping. For most map curators, a graphic index showing sheet coverage across a country would be preferable to a list of sheet titles in sheet order, but in practice, NLS website statistics show that most users prefer a textual list over a graphic index when presented like this.
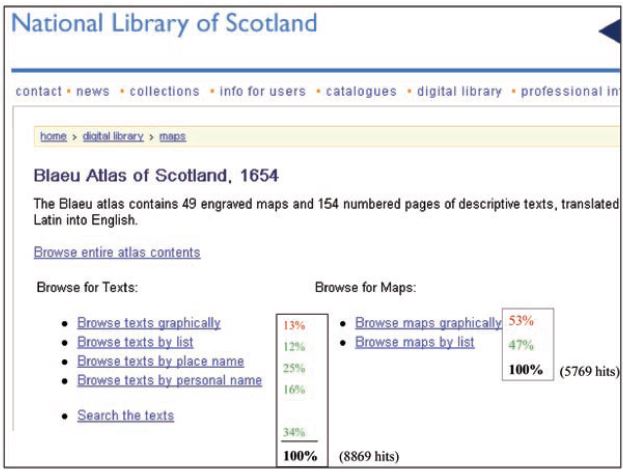
Figure 2: Blaeu Atlas website homepage — textual (green) versus graphical (red) access methods.
In the Blaeu Atlas of Scotland website (Figure 2), where those searching for textual county descriptions could choose five options, most (34%) chose the keyword-in-box method, followed by the textual (place-names index) (25%), and the personal names index (16%) before the graphical map of regions (13%). However, the map of regions was preferred to their textual listing, perhaps reflecting the lack of knowledge of the older 17th-century regional extents. For the related map search option, when there was no option for keyword search or indices of place names or personal names, the map search was again only marginally preferred (53%) over the text search by region name.
In addition to website statistics, usability studies can also highlight difficulties that many users have with graphics. A usability study of the NLS ArcIMS applications revealed some serious problems with the interface (Fleet, 2006). In general, users found the site too complex, and ignored much of the functionality or did not use it correctly. Many of the standard web-mapping icons for buttons, such as those for panning, zoom by rectangle, and selection rectangle search were poorly understood, even with mouse-over explanations. Users found the site annoying and frustrating, taking too long to find information, and hand to navigate. More than one user commented that if there was a more familiar and straightforward way of searching, like a text-box search, they would choose that over dynamic mapping, and some of the implications of this are discussed further in section 4 below.
It is important that map collections focus on information content for the long term, rather than on presentation, and avoid getting too sidetracked by particular website fashions and software solutions. For example, by holding a series index as a set of vector rectangles — a shapefile — it is easy to generate multiple raster graphics of different types (Figure 3).[9] The sheet details of the map series, held as metadata in a database, can also be flexibly exported to form multiple textual lists in different orders. It is also possible to integrate this metadata with rapidly changing web-mapping technologies, for example, by exporting the geo-referenced map as a KML file, or integrate its boundaries with other boundaries as a union catalogue of digitised maps. The geo-referenced information and metadata have a long-term value and can be repurposed toward multiple ends, whereas the various presentation options have a more ephemeral and short-term role.
A second factor that supports a focus on metadata, rather than on search interfaces, are the developing gazetteer and geo-referenced metadata portals that can provide sophisticated search and retrieval services for digital maps. For example, within the United Kingdom, the Vision of Britain project, or EDINA's Go-Geo demonstrate simple yet powerful geographic retrieval based on geo-referenced names, administrative units, and boundaries over time. Internationally, projects such as the Alexandria Digital Library, the Electronic Cultural Atlas Initiative, and the DIGMAP Project have applied these techniques more widely. By translating textual and map-based search methods into geographic coordinates, and then retrieving geo-referenced resources based on coordinate searching, many inconsistent and complex traditional and local geographic thesauri and vocabularies can be bypassed and superseded. These new web-based tools and services, and their range of geo-referenced gazetteers, are more comprehensive than those that individual map collections can offer, and provide mechanisms for powerful geographic searching across dispersed collections on the web.
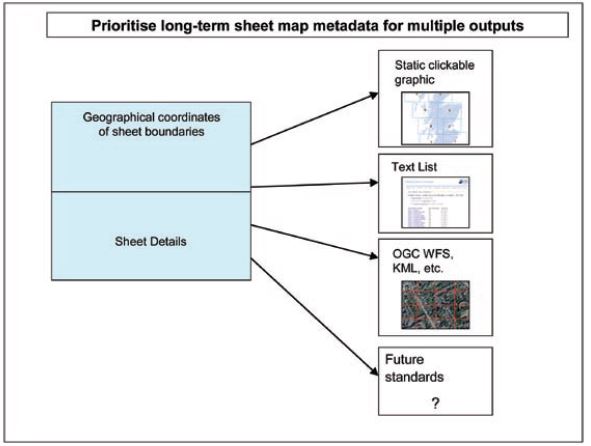
Figure 3
Due to limited resources, map libraries should be focused about which parts of their collections can be catalogued, made available as online images, and geo-referenced. It is rarely the case that most larger map libraries even have basic records for all their series mapping, and under such circumstances, scanning and geo-referencing can seem an expensive luxury. However, the substantial benefits of making available real map content as images, rather than just metadata, and the need for proper scanning and geo-referencing to be accompanied by proper cataloguing and recording of metadata, should allow both activities to be pursued in tandem for selected parts of the collection.
It is helpful to visualise these various methods of providing access to series maps as a hierarchy (Figure 4) where the traditional cataloguing of a series supports progressively more detailed access to the map contents of the series itself. The proportion of resources spent on these multiple activities will be different for each library, and vary over time, recognising that other libraries will be able to dovetail and complement work geographically by focusing on these activities for other cartographic materials.
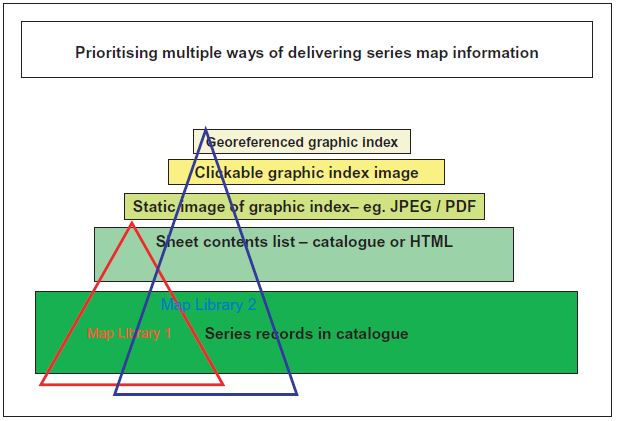
Figure 4
Technology provides a growing ability to transform maps and present them in new ways, linked to other geo-referenced information, and with ever-changing backdrops. Whilst these methods may have a value, they are never a complete substitute for showing original authentic images of maps, just as images themselves are never a complete substitute for real hard-copy mapping. Geo-referencing of maps too easily promotes the importance of the real-world locational aspects of the map above other features. Particularly for historical maps, geo-referencing can impose a contemporary, post-Enlightenment set of values on cartographic artefacts, whose creators and users may never have intended them to be viewed in these ways. For the Roy Military Survey of Scotland (1747–1755), it was felt that warping and rubber sheeting was less helpful than an authentic presentation of the map in its original state, and the geo-referencing was therefore a basic rotation and scale change to best fit a modern outline (Fleet & Kowal, 2007).
Warping and rubber-sheeting of historical maps, particularly those not based upon trigonometry or precise equipment, can degrade and obscure the proper understanding of them, and lead to erroneous assumptions about their accuracy and informational content. In addition, although mosaicked, geo-referenced series maps have their advantages, there is usually real information content in sheet margins that should also be made available to users. An awareness of the cultural and non-representational meanings in maps, and how easily new meanings can be created through digital technology, also leads to a respect for displaying original items as they are.
For scanning maps, there is good practical guidance on the appropriate resolution and colour bit depth to use to hopefully avoid the need to repeat work. As there is less expertise on geo-referencing, the practicalities of the process, and what vital information and degree of accuracy is required for particular maps and particular purposes to avoid the need to repeat work, this is a subject requiring attention and a shared dialogue.
Although web presentation of series mapping demands a reformulation of traditional techniques, much historical expertise, theory and literature and its conclusions are very relevant in the online environment. For example, Jacques Bertin's classification of the six retinal variables (size, value, texture, colour, orientation and shape) is still fundamentally useful in designing a good online graphic index, with form and colour of most use in differentiating qualitative data such as series maps (Bertin, 1967). Similarly Edward Inhof's laws of colour provide useful principles for creating aesthetically pleasing and intuitive graphic images (Imhof, 1982). Good graphic design should make it a pleasure to visit a particular site, with the design serving the main purpose.
These different technical solutions commodify historical maps in different ways. Whereas digitisation of maps allows new market possibilities, geo-referencing dramatically adds further added value through the much greater range of information that can be integrated with the maps. Our survival as institutions depends upon realising the value of our collections in this information marketplace, and the added value of geo-referencing. This is not necessarily for exploiting this commercial potential ourselves — income generation may be a less important objective for us than other priorities — but of maintaining proper control over this geo-referenced content. Many map libraries, often through inability to finance geo-referencing have effectively sold on rights to digital and geo-referenced images of their mapping to commercial companies. These companies have much greater resources and expertise to make available our collections, leaving a diminished or minimal role for map libraries in the commercial information landscape.
The experience of designing and using these different methods for accessing historical mapping, combined with the website statistics and usability studies, point to the continuing and growing need for a range of methods. Where choices are provided, textual lists, a range of static graphics as well as zoomable maps are all used, and each have their special advantages over the others. The choice of method and mix would depend on a range of criteria, not least the size of the map collection and its importance, the broader context of the website, and especially the institutional resources, expertise and time available.
In spite of the difficulties of anticipating future technology, there are real advantages in transcending traditional metaphors of analogue map searching, in going beyond the graphic index. Dynamic zoomable maps with overlaid series rectangles, and with other geo-referenced search methods move beyond the confines of the traditional static graphic index. In that geo-referenced search methods — textual (e.g. addresses, place names, jurisdictions) and graphical can all define a location with coordinates, these coordinates can then match and retrieve geo-referenced sheets in a series. Given the clear preference by many — at least a significant minority — for a keyword text search in boxes, avoiding maps, to retrieve sheets, we should expect to see this furthered in future, so that textual search methods will retrieve series mapping, geo-referenced directly as rectangles or through other geo-referenced units.
A further conclusion would be the importance of designing the website for multiple access points. Within the last few years, the predominance of search engine access has increasingly bypassed the website's own search/browse mechanisms. This has not only tended to emphasise textual lists over graphical alternatives, and the declining relevance of all the site specific access methods described in this paper, but also heightened the importance of good navigational guides, site diagrams, scrollable buttons for browsing, and links to related components.
There is no prescriptive solution to making series mapping available over the web, but a growing range of possibilities, each with strengths and weaknesses. Although impressive results can be obtained with zoomable mapping and big investments of money and time, simple, basic access methods and records also have enduring value. These are technologies that map curators are well placed to develop and by applying them in the right way, they are a key strategy for our future survival.
Alexandria Digital Library, http://alexandria.sdc.ucsb.edu/
EDINA Go-Geo, http://www.gogeo.ac.uk/
DIGMAP Project, http://www.digmap.eu/doku.php
Electronic Cultural Atlas Initiative, http://www.ecai.org/
Google Earth, http://earth.google.com/
Google Maps, http://maps.google.com/
National Library of Scotland maps website, http://www.nls.uk/maps
Old Maps Online, http://www.oldmapsonline.org/
Open Geospatial Consortium's standards (especially WMS/WFS), http://www.opengeospatial.org/standards
OSGeo, http://www.osgeo.org/
Vision of Britain, http://www.visionofbritain.org.uk/index.jsp
|
Bertin, J. (1967). Sémiologie Graphique. Paris, Gauthier-Villars. Trans. as Semiology of Graphics (1983). Wisconsin : University of Wisconsin Press..
|
|
Fleet, C. (2000). Distributing images and information over the Web — a case study of the Pont manuscript maps. LIBER Quarterly 10(4), http://liber-maps.kb.nl/articles/12fleet.html.
|
|
Fleet, C. (2005). Web-mapping applications for accessing library collections: case studies using ESRI’s ArcIMS at the National
Library of Scotland. LIBER Quarterly 15(1), http://liber-maps.kb.nl/articles/14fleet.html.
|
|
Fleet, C. (2006). ‘Locating trees in the Caledonian forest’: a critical assessment of methods for presenting series mapping
over the web. e-Perimetron 1: 99–112, http://www.e-perimetron.org/Vol_1_2/Fleet/Fleet.pdf.
|
|
Fleet. C. & K.C. Kowal (2007). The Roy military survey of Scotland (1747–55): mosaicing, geo-referencing and web-delivery,
e-Perimetron, vol. 2(4) Autumn 2007, pp.194–208, http://www.eperimetron.org/Vol_2_4/Fleet_Kowal.pdf.
|
|
Imhof, E. (1982). Cartographic relief presentation, ed. by H. J. Steward. Berlin, New York: Walter de Gruyter.
|
|
Pridal, P. & P. Zabicka (2008). Tiles as an approach to on-line publishing of scanned old maps, vedute and other historical
documents. e-Perimetron Vol. 3(1), http://www.e-perimetron.org/Vol_3_1/Pridal_Zabicka.pdf.
|
|
Roy, W. (2007). The Great Map: the Military Survey of Scotland 1747–55, with introductory essays by Yolande Hodson, Chris Tabraham and Charles Withers. Edinburgh: Birlinn.
|
|
See also the OSGeo website (http://www.osgeo.org/), and Old Maps Online (http://www.oldmapsonline.org/) |
|
|
This statement is credited to Nancy Tosta, Vice President of Ross & Associates, in an article about GIS in the Computer World news. |
|
|
Landscape, Environment and History MSc, http://www.shc.ed.ac.uk/ postgraduate/taught/landscape/ |
|
|
See, for example, the Ordnance Survey large scale town plan for Burntisland (http://www.nls.uk/maps/townplans/burntisland.html) |
|
|
See, for example, the 12-sheet Bartholomew Plan of Edinburgh (http://www.nls.uk/maps/joins/1028.html) |
|
|
See for example, the graphic index to William Roy's Military Antiquities of the Romans in North Britain: http://www.nls.uk/maps/roy/antiquities/plates.html |
|
|
See for example, the tile map mosaic for the Ordnance Survey Popular edition maps at: http://geo.nls.uk/popular/. This was created using the GDAL2Tiles application (http://www.klokan.cz/projects/gdal2tiles/). See also http://www.oldmapsonline.org for other innovative open-source applications relating to placing historical maps online and Pridal & Zabicka (2008). |
|
|
See the ArcIMS applications at: http://geo.nls.uk |
|
|
The static clickable graphic indexes at http://www.nls.uk/maps/os/oneinch_1st_graphic.html, http://www.nls.uk/maps/os/oneinch_2nd_graphic.html, http://www.nls.uk/maps/os/oneinch_3rd_graphic.html have all been generated from the same vector shapefile. |