ABSTRACT
This paper is intended to open up discussion on potential co-operation, which would enable participants restricted by unequal resources and technologies to participate in a pan-European project. The idea has not yet been fully developed but the purpose of the project is to allow digital maps to function not only as geographic resources and educational tools, but to act simultaneously as an interface to metadata-databases. These would contain descriptions of maps and spatial databases, as well as locational or geo-referenced resources in books, periodicals, and the Internet.
INTRODUCTION
The Groupe des Cartothécaires (GdC) functions mainly as a platform for communication and information exchange. This has been made possible in four main ways. First, LIBER kindly publishes papers and progress reports from our conferences in the LIBER Quarterly. We hope that when a decision is made to publish this journal in a hybrid form that the GdC will still be able to use the paper form or have access to an integrated Internet version. Although the ‚status apart‘ of the GdC works reasonably well, we think it is of overall importance that the collections and developments within our field are integrated into overall library developments. Second, we have developed our own homepage, which is hosted by the Royal Library of The Netherlands. This contains full-text versions of all papers, progress reports, and other relevant documents published since 1992 (c. 120 documents). It is visited some 35–40,000 times annually. Third, the communications of the Secretary of the GdC and others, are circulated in a biannual newsletter, of which No.6 will be published shortly. Fourth, an e-mail discussion list is hosted by the National Library of Scotland. Although this has not yet generated heavy traffic, we hope that our correspondents will use it more intensively for discussions and exchanging ad hoc information.
Another function of the GdC, which is starting to materialise slowly, is that of co-operation. The GdC Working Group for Central and Eastern Europe is putting together a training programme for our Eastern European colleagues. Until now this has resulted only in some bilateral training, as we have been unable to find the means to finance the larger part. We hope we can do so with the help of the LIBER Board, or that the programme can be incorporated into a larger programme. As it happens, the Annual General Meeting 2000 of LIBER recently gave a mandate to the LIBER Executive Board to set up a Task Force on Training, aimed at the library community as a whole. Also, since 1998, our Working Group for Education has been busy building an Internet site1, where a large body of information and literature for education in map curatorship has been created very rapidly. The site is hosted by the Eidgenössische Technische Hochschule in Zürich. Co-operation can be achieved in many ways, but it would be very rewarding if the documents, which we conserve, were instruments in this.
The sections which follow discuss a marketing study showing the willingness of institutions to participate, a potential project in The Netherlands concerning a visual geographical interface to show a theoretical framework, and an idea for a pan-European project, based on co-operation.
MARKET RESEARCH
Between December 1999 and March 2000, the Alterra Library of the Agricultural University of Wageningen in The Netherlands undertook market research for a Union Map Catalogue and electronic delivery of cartographic materials (Slijkhuis, 2000). Electronic delivery was almost a precondition. Of the 380 institutions contacted, some 140 responded. This level of response makes the drawing of conclusions viable. Most responding institutions work in the field of the earth sciences and need maps as professional tools for their daily work, projects, or policies. About half of them have a staff of more than 100. More than 50 per cent of these 140 institutions reported that all their personnel had Internet access, with the remaining 50 per cent having less access. The response to the question whether they wanted to have access to an online catalogue was overwhelmingly positive. This is not a surprise given the heavy use of online library catalogues.
When asked how they wanted access to the Union Map Catalogue, 98 per cent responded that they wanted to search for an area, while 95 per cent wanted to search thematically. Only 40 per cent would search for a title or year of publication, and almost all other responses concerned innate properties of cartographic materials, like scale, accuracy, technical data, format, source etc.
When asked whether they wanted to pay for developing and access to the Union Map Catalogue, 57 per cent responded affirmatively, though this depended partly on the quality/price ratio. As a follow-up to this question, they were asked whether they wanted to view simultaneously the item described, and whether this might be a low-resolution image. Both questions had an affirmative response well above 50 per cent. Most did not want to pay for viewing a low-resolution item. The question of whether they were willing to pay or not depended mainly on whether the search was successful or on the ratio of use, the latter being a truncated pricing system. Most respondents preferred a cost-free search system, but were willing to pay for positive results (i.e. which resulted in ordering or buying specific datasets). Most institutions wanted potential electronic delivery of map-files, and this to be done through standardised transfer standards, to enable receivers to process the electronic files directly into their own software, which were mainly Geographic Information Systems (GIS).
Another result of this market research was that many institutions saw profit in co-operation to create this union catalogue and data-delivery system. It is the author’s opinion that when this kind of market research is done in other areas or countries with groups of professional users of geographic in-formation, the results will not differ greatly from those described above.
AN ATLAS AS A GEOGRAPHICAL INTERFACE
The following example is a project proposal drafted by the author, in cooperation with a number of university departments of cartography in The Netherlands. Its purpose is to have maps function not only as geographical information sources, but also to investigate whether it is possible to have the same maps function as a visual interface for metadata-databases. For this project we looked at three possible databases, which might function together within this framework:
- National Clearinghouse Geo-Information
The NCGI metadata-database currently contains more than 1500 descriptions of digital spatial datasets with visual examples of some 17 producers of geospatial data. Datasets range in size from several hundreds of megabytes to tens of gigabytes (NCGI, 2000). - Scientific Atlas of The Netherlands (AvN)
The second analogue edition of the AvN, published 1984–90, contained some 1000 maps, which give a comprehensive view of the socio-economic, physical, and ecological situation in The Netherlands. These maps have been digitised, but give information which is no longer up to date (Disciplinegroep Kartografie, 2000). - Dutch Depositary Collection in The Royal Library
Comprises a database of 30–40,000 descriptions of cartographic documents concerning The Netherlands. In 1999 the Royal Library phased out the CCK system (Velden,1992) and between 2000 and 2002 will convert these descriptions to the PICA database (PICA 2000).
The NCGI contains mainly large-scale datasets with a high economic value. The owners of these datasets, which are usually (semi-)governmental or academic bodies, are usually forced to recoup part or most of the costs involved in producing the data. At the same time, these producers aggregate the data into the middle-and small-scale data necessary to create the maps used in the Scientific Atlas of The Netherlands. In the age of analogue products this service was free. However, in the digital age there have been difficulties in getting a free service and we must find a way to encourage them to create and provide these data at no cost. We think we can achieve this goal by offering the maps of the Scientific Atlas of The Netherlands as a visual geographical interface to the NCGI. The geographical interface shown in Figure 1 provides several search strategies:
- click on a map of The Netherlands to search the underlying metadatadatabases for datasets which also cover the whole of The Netherlands;
- select part of The Netherlands to search the underlying metadata-databases for datasets which also cover that part of The Netherlands;
- zoom into the interface to query the underlying metadata-databases for datasets, which cover that specific part of The Netherlands.
The queries would be defined mainly by using bounding-box co-ordinates. There must be also be opportunities for searching on point locations, within a radius of a point, a bounding polygon etc. and, when the enquirer’s computer can read the index-map, also on named area, administrative sub-division, or locality description, using a thesaurus when necessary. But it must be also possible to use traditional geographic and thematic dictionaries to give the same result.
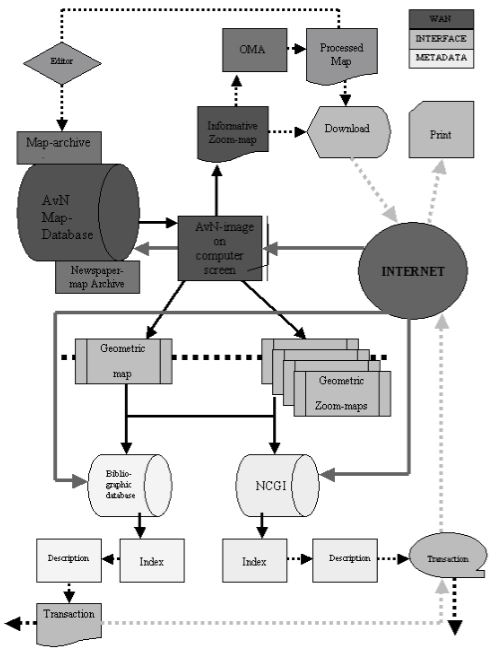
Figure 1
There seems no better way for the producers to advertise the economically interesting digital datasets than through such an interface and at the same time to serve education and the general good! The Scientific Atlas of The Netherlands would not only function as a visual geographical interface, but would be an information and educational resource at the same time. The educational functions would be enhanced and become interactive when an Online Mapping Application (OMA) was incorporated with which users could manipulate certain aspects of the maps offered. Maps produced with this application could be selected by an editor and added to an archive to serve as examples for future users. In the meantime, some scanned samples of newspaper maps have been added to the present database to gain an insight into the way the mass media uses scientific mapping data to inform the general public. In future, digital maps from newspaper archives could be downloaded to a sub-database of The Scientific Atlas of The Netherlands and have the same functionality as maps added from the OMA activities.
But why should we restrict ourselves to spatial metadata-databases for digital materials and not try to include metadata-databases for analogue ma-terials? As long as the descriptions include geographical bounding-box co-ordinates, the same kind of queries can be made on bibliographic databases as on the NCGI database. Because researchers require disparate sources to do their research, and because not all the necessary information will be available on the Internet or in suitable digital form, it would be unfortunate if bibliographical databases were left out of this scheme. The 30–40,000 descriptions of maps, which will be loaded into the PICA database, contain all the necessary geometric or mathematical data necessary to use the query functions envisaged in the NCGI. Furthermore, the idea of one-stop-shop information gathering is so prevalent that we must do our utmost to realise this concept with the tools and data at hand. Following discussions with the Netherlands Council for Geographic Information (RAVI), an advisory ministerial body, we feel that a project such as the one we have described might be realisable within a few years. The problems of geographic information retrieval (GIR) for both map-like spatial objects and other geo-referenced material such as text are well described in a paper by Larson (1996) on the Alexandria Digital Library project.
As with traditional print libraries, information can be indexed and re-trieved in a variety of ways, ranging from purely descriptive cataloging of items in the database and topical analysis of content, to more specialized methods of classification and description that exploit the characteristics of digital information.
A CHANGING METADATA CREATION AND RETRIEVAL ENVIRONMENT
The Dutch project described above is concerned, in the first instance, with modern material for which the interface maps have yet to be created. In a European context, we would start from a different premise. One of the questions, which might arise, is what the library’s function will be in future. Will we become purely information brokers for the content we own, or will we be able to deliver something more than our own content? At the moment we are building metadata-systems which are aimed at the traditional library functions of ‚find‘, ‚identify‘, ‚select‘, and ‚obtain‘. At the same time we are creating more kinds of manifestations, in the wording of the report on Functional requirements for bibliographic records (IFLA, 1998), of the content we hold e.g. photographs, microfilm, and digitised objects. This is not so much creating newer services as making the delivery of certain objects faster or easier.
In the case of metadata some work might still be done to enhance our databases. The author does not think the minimal description advised in the Functional requirements for bibliographic records will lead us to paradise! But cost-effectiveness seems to give us no choice. The alternative is to make computers and software do more of the work. For instance, in The Netherlands some two million pages of daily newspapers have been microfilmed (Koninklijke Bibliotheek, 2000). The reason for this project was, of course, conservation. But now that they are microfilmed we have the opportunity to enhance our metadata system. Many clients ask for specific information from papers but really do not have any idea where to look for it, except that the event has taken place in a certain area at a certain time. Should the library world decide to digitise this microfilmed content, it will be possible to index its contents quite easily. Papers are published in a certain lay-out using a special character-set and use specific heights for different kinds of headings. It must be possible to develop some software, which can easily read the contents and recognise the function of certain pieces of text by their form and lay-out. In this way the computer can be programmed to create an index of the digitised contents, and make access much easier. The technology could be likened to the Pharos architecture used in the Alexandria Digital Library (Dolin, 1998), though the first subject of investigation here was newsgroups.
Nothing has yet been added to the information value of the content we provide. These are no more than objects, which are linked either through metadata or through references included in the object. It is the author’s view that libraries should not only provide the relationships between ‚works‘, ‚expressions‘, ‚manifestations‘, and ‚items‘, as outlined in the report Functional requirements for bibliographic records, which is concerned with metadata, but also find a mode to actually deliver the documents which are described in this string, that is, we should look at ways in which we can add value to the content we own. This content will naturally be limited to copyright-free material and the material to which owners have waived their rights. What we have to try to imagine here is a future library, where its data and metadata will function as an active and dynamic component of the digital information world.
MULTI-SPEED PAN-EUROPEAN CO-OPERATION
Let us now turn to maps. Cartographic materials are knowledge sources in themselves. They present, in a graphical way, uniquely aggregated information concerning phenomena directly or indirectly associated with a location and time relative to the surface of the earth. In this present case the topic is topographic maps which display actual objects or phenomena which are visible on the earth’s surface and as such are represented. These are physical or man-made features like waterways, vegetation, settlements, roads, railways and canals, and orography or representations of height. As we can use, in the first instance, only copyright-free material, this discussion is limited to 19th century topographic maps. In Europe we are not in the fortunate situation of the United States where contemporary topographical maps at scales of 1:24,000, 1:25,000, 1:63,600, and 1:100,000 are freely available on the Internet (TopoZone, 2000). Why 19th century maps? In the 19th century, state and regional governments started, for the first time, to publish large scale map series (scales 1:25,000–1:300,000) based on geodetic triangulation, including geographic co-ordinate grids, and covering the whole of the country or area with the same information content. Being knowledge sources in themselves, these paper maps can be used at the same time as digital geographical interfaces thanks to their underlying mathematical properties.
The purpose of this discussion paper is to launch the idea that in a Europe without borders, and without loss of regional cultural contexts, these topographical map series can be used to foster a multi-phased, pan-European project in which unequal partners with unequal resources can co-operate. The availability, lack, or divergence of certain technologies do not have to be a hindrance to achieve common goals. And, of course, the Internet will be the carrier technology. To create a framework, a first stage could be to make available the index maps to the map series. This would mainly involve scanning the paper index maps. This would not create seamless index maps as series sometimes cross borders or overlap. They can also cover different time periods, depict different information, and may have different mathematical properties. A super-index could be created by scanning a map of Europe with national boundaries and links to the separate islands of index maps. This would show that many topographic map series cross current national borders, but this need not be a hindrance.
In a second stage, these index maps should be linked to the scanned or digitised version of the sheets of the map series. The link should be created not by incorporating the addresses of the scanned maps, but by geographical co-ordinate search (point-in-polygon, region, distance and buffer, path) using the geometrical properties of the index-maps and the resulting queries of bibliographic databases. These describe, among other things, the geometric properties and mathematical data of the scanned images. The realisation of this part of the project could be done as isolated projects, which would slowly evolve into an overall patchwork map in many parts and with many possible layers. Development at different regional speeds may have very beneficial educational aspects as areas which are less developed technologically may learn from those which are more advanced. And it must be possible to use different standards of quality as maps from countries with many built-up areas will have a different information-content from countries with extensive rural areas. Experience has taught the author that a dirigiste approach to such a project is sure to fail as implementing the highest standard practices will outlaw certain potential participants who can only attain a lower standard. It will be acceptable that certain areas are finished quickly while others may still have to wait for some years before they can participate. Images may be provided in .gif, .jpeg, tiff or any format accepted by Internet protocols and in many resolutions as single, multiple or wavelet images. But they can also be made into interactive maps by including their geometric properties as a dynamic basis.
THERE IS NO END TO THE POTENTIAL
This could be the beginning of a larger project. Locational information can be found in many other sources besides cartographic materials. When we look at documents concerning statistics, history, biology, ecology, travel, etc., many of these are concerned with a particular location on earth. In traditional library catalogues these are mainly accessed by subject matter, but not according to geographical area. It is the author’s view that a researcher is always looking for a body of interrelated information to will provide knowledge for the subject on which he/she is working. And we would like maps to be studied in context, which means textual and statistical resources should be available at the same time.
Of course we can use the traditional geographical and subject dictionaries and thesauri for this purpose, but why not use the unique mathematical properties of maps in an age where visual information and the possibility of aggregating information in graphical representations are becoming more and more predominant? When we can translate subject thesauri for locations (like Amsterdam, The Netherlands, USA, etc.) through a conversion table to bounding-box co-ordinates, the same interface might be used for directing users to these non-map resources.
A new model for automated Geo-referenced Information Processing System (GIPSY) of text documents is described in detail by Woodruff & Plaunt (1994) and summarised by Larson (1996). In GIPSY words and phrases containing geographic place names or geographic characteristics are extracted from the documents. They are then used to provide evidence for probabilistic functions using elementary spatial reasoning and statistical methods to approximate the co-ordinates of the location being referenced in the text. The actual ‚index terms‘ assigned to a document are a set of co-ordinate polygons that describe an area on the Earth’s surface in a standard geographical projection system. This method has been evaluated, together with the POSTGRES method and the TextTilling method, in a paper for the Sequoia 2000 project in the framework of the Global Change programme (Larson, 1995).
There are several prototype Geographic Information browsers available on the Internet which can perform a similar function to GIPSY. These include:
- Environmental Resources Information Network Unit of Australia ERIN has developed a generic WWW map interface using a collection of simple map images and a standard lookup table to provide visual interactive access to geographically-related information (Crossley & Boston, 1995).
- Meadowlands Environmental Research Institute, New Jersey, USA MERI built a WWW-based interface to the database, integrating web server, database server, and GIS server technologies. Through a map interface, a user can obtain a list of documents that studied a particular area. Conversely, through a text interface, a user can obtain a list of documents that report on, for example, a land use or cover type or a specific water body, with sampling/analysis locations displayed on a map (Barrett et al, 1999).
CONCLUSION
A new search-engine in Netscape, called WebBrain (TheBrain, 2000), is a combination of a display of the information found in a graphic environment as well as lists of hits. It is the author’s view that this is the first in the development of new search-engines, which have the advantage that they can visualise the overall supply of digital objects concerning a certain topic-search. The same can be done using maps in a historical context. Converting or creating the descriptions to modern catalogue systems seems not to create a much more effective access. But using them as interfaces might give them more value as access tools as well as using their information content far more efficiently.
REFERENCES
1. http://www.maps.ethz.ch/gdc-education.html.
Barrett, K.R., Holowczak, R. & Artigas, F.J. (1999). A database of environmental documents about an urban estuary, with a WWW-based, geographic interface.
http://www/awra.org/proceedings/www99/w21/ [Accessed 24 September 2000]
Crossley, D. & Boston, T. (1995). A generic map interface to query geographic information using the World Wide Web. http://www.csu.edu.au/special/conference/apwww95/papers95/dcrossle/dcrossle.html [Accessed 24 September 2000]
Disciplinegroep Kartografie (2000). Atlas van Nederland. http://avn.geog.uu.nl [Accessed 24 September 2000]
Dolin, R. (1998). Using automated classification for summarizing and selecting homogeneous information sources. D-Lib Magazine, January 1998. (ISSN 10819873). http://www.dlib.org/dlib/january98/dolin/01dolin.html [Accessed 24 September 2000]
Eidgenössiche Technische Hochschule Zürich (2000). The gateways to ‘Education and literature for map curatorship’. < http://www.maps.ethz.ch/gdceducation.html [Accessed 24 September 2000]
IFLA (1998). Functional requirements for bibliographical records. UBCIM Publications New Series (19). http://www.ifla.org/VII/s13/frbr/frbr.pdf [Accessed 24 September 2000]
Koninklijke Bibliotheek (2000). Koninklijke Bibliotheek laat twee miljoen krantenpagina’s op microfilm zetten. http://www.kb.nl/kb/pr/pers/pers2000/ krant.html <> [Accessed 24 September 2000]
Larson, R.R. (1996). Geographic information retrieval and spatial browsing. In L. Smith & M. Gluck (Eds.), GIS and libraries: patrons, maps and spatial in-formation, pp. 81–124. http://sherlock/berkley.edu/geo_ir/PART1.html (preprint) [Accessed 24 September 2000]
Larson, R.R., Plaunt, C. Woodruff, A.G. & Hearst, M.A. (1995). The Sequoia 2000 Electronic Depository. Digital Technical Journal (7.3), pp. 50–65. <http://www. digital.com/DTJJ04/DTJJ04SC.TXT> (preprint) [Accessed 24 September 2000]
NCGI (2000). Geo-ids. http://www.ncgi.nl/Profiel/profiel.html [Accessed 24 September 2000]
PICA (2000). About PICA. http://www.pica.nl/en/about/ [Accessed 24 September 2000]
Slijkhuis, H. (2000). Alterra: catalogus voor kaarten: rapport over de marktverkenning in het project Alterra: catalogus voor kaarten, in opdracht van Alterra, Wageningen UR.
TheBrain (2000). About. http://www.webbrain.com/about_frame.html [Accessed 24 September 2000]
TopoZone (2000). http://topozone.com [Accessed 24 September 2000]
Velden, G.J.K.M., Douma, P.J.M. & Zandstra, J.G. (1992). CCK: making cartographic materials accessible. LIBER Quarterly (2.2), pp. 192–208. http://www. kb.nl/infolev/liber/articles/cck.htm [Accessed 24 September 2000]
Woodruff, A.G. & Plaunt, C. (1994). GIPSY: geo-referenced information processing system. Journal of the American Society for Information Science (45), pp. 645–55.